
What This Guide Helps You Do #
Use this guide when you want to show a dashboard on a TV even though you do not have a live API yet.
By the end of this setup, you will have:
- a TV with the Twinnoverse Reader app installed
- a claimed device in your Twinnoverse dashboard builder admin portal
- a layout designed for that TV
- a Manual data source linked to that layout
- a playlist assigned to the device
- manually entered KPI values showing on the screen
Before You Start #
Make sure you have all of these:
- access to the Twinnoverse admin portal
- a smart TV or Android display device where the Reader app can be installed
- internet access on that device
- permission to install an APK on that device
- a clear idea of what information the screen should show
Part 1: Install the Twinnoverse Reader APK on the TV #
1. Download the APK #
Download the Twinnoverse Reader APK from this link:
2. Copy the APK to the TV or Android Device #
Use any method that works in your environment, for example:
- direct browser download on the device
- USB drive
- device management tool
- file-sharing app
3. Allow APK Installation if Required #
On many Android TVs or Android boxes, you must allow app installation from outside the Play Store.
4. Install the APK #
- Open the APK file.
- Confirm the installation.
- Wait until the app finishes installing.
- Open the Twinnoverse Reader app.
5. What You Should See After Opening the App #
On first launch, the Reader app should show a claim screen(Note: Claim code reset every 3 minutes).
This means the TV is ready to be connected to your Twinnoverse organization.
Do not close the app. Keep the claim screen visible while you complete the next steps in the admin portal.
Part 2: Create the Device in Twinnoverse and Claim It #
6. Open the Devices Area #

- Sign in to the Twinnoverse admin portal.
- Open Devices.
- Click Add Device.
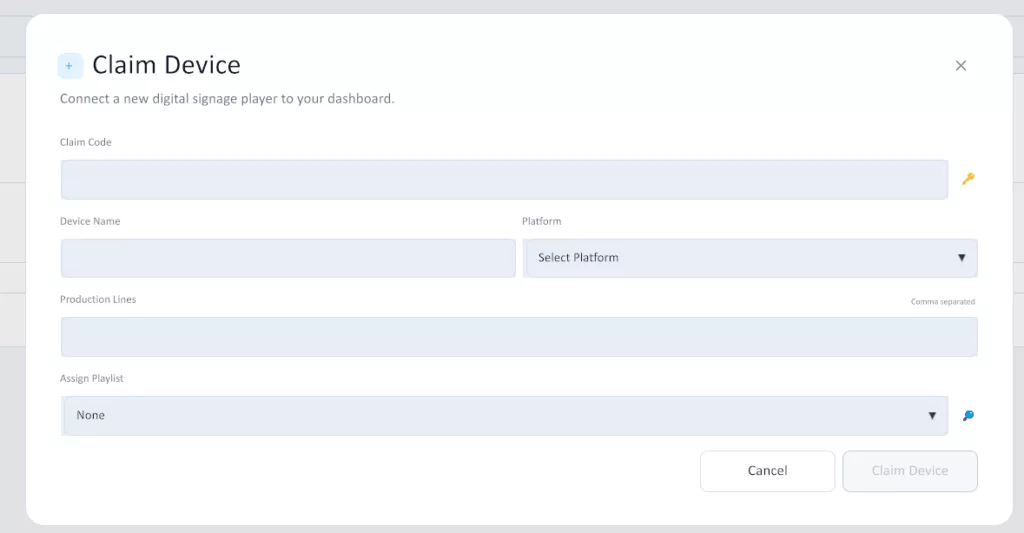
7. Enter the Claim Code on the TV #
- Go back to the TV.
- Enter the claim code exactly as shown in the admin portal.
- Confirm the entry on the TV.
- Give the device a name and press save(we can configure the other data later).
8. What Happens After Claiming #
After a successful claim:
- the TV is registered as a device in Twinnoverse
- the TV receives its secure device identity
- the TV becomes available for playlist assignment.
Back in the admin portal, you should now see the device row.

Part 3: Create the Manual Data Source #
9. Open Data Sources #

- Open Data Sources in the admin portal.
- Create a new data source.
10. Choose the Correct Type #
Choose Manual as the data source type.
This is important.
A Manual data source means:
- the TV does not call a REST API
- the TV does not wait for WebSocket updates
- the TV does not read data from an Ingest gateway
- users enter the runtime values manually inside Twinnoverse admin panel
Use a Manual data source when:
- the integration is not ready yet
- supervisors enter numbers during the shift
- operators update the content by hand
- you need a working dashboard now without backend development
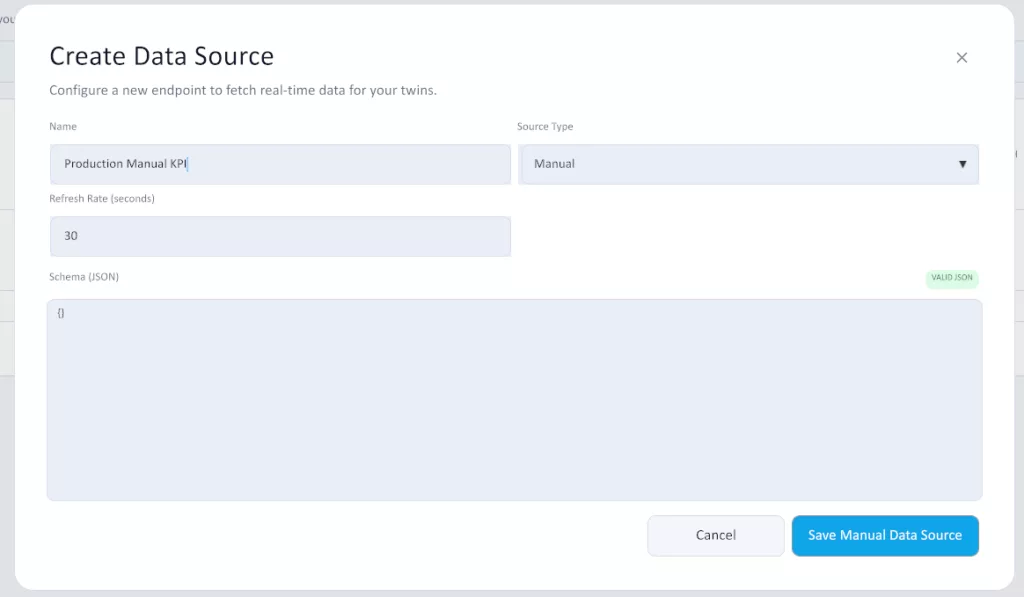
11. Name the Data Source Clearly #
Use a name that explains its purpose, for example:
Production Manual KPIWarehouse Shift Board ManualMaintenance Manual Dashboard
Save the data source.
Part 4: Create the Layout #
12. Open Layouts #

- Open Layouts.
- Create a new layout.
- Name it
13. Understand the Screen Shape Before Designing #
Twinnoverse layouts are designed for a 16:9 landscape screen.
The default working canvas is:
- 1920 x 1080
This means your layout should be planned as a wide horizontal screen, not as a portrait or square screen.
When designing the layout:
- keep the most important numbers large and easy to read
- use the top area for headline information
- use the middle and lower area for trends, lists, alerts, and notes
- avoid making the screen too crowded
If too much information must be shown, it is usually better to create more than one layout and rotate them in a playlist.
14. Choose the Widgets #
For a Manual KPI dashboard, the most useful widget types are usually:
- KPI for one main value
- KPI Double for two related values
- Progress Bar for current versus target
- Target Actual for side-by-side comparison
- Sparkline for simple trends
- Table List for rows of operational data
- Alerts List for incidents or active warnings
- Text Block for notes, messages, or instructions
- Content (Image) for a diagram, floor plan, or reference visual
- Feel free to explore the rest of the widgets
Choose widgets based on what users need to understand at a glance.
Examples:
- if users only need one big production number, use KPI
- if users need progress toward a goal, use Progress Bar
- if users need a row-based list of issues, use Alerts List or Table List
- if users need a written shift note, use Text Block
Basic Interactions
- To add a new widget, first click on an empty area of the canvas so no widget is selected, then click the widget you want from the library panel.
- To move a widget, click and drag it to the position you want on the layout.
- To resize a widget, select it first, then drag its resize handles to make it wider, narrower, taller, or shorter.
- To replace a widget, click the widget on the canvas so it is selected, then click another widget type from the library. The selected widget will be replaced.
- To style the whole layout, deselect all widgets first. This lets you edit the global layout settings such as background color, chrome, and overall theme colors.
- To style only one widget, click that widget and change its own background or color settings in the inspector.
- Use global colors when you want the full screen to feel consistent.Use widget-level color overrides when one widget needs to stand out from the rest.
15. Add the Widgets to the Layout #
- Add the widgets you need.
- Position them on the canvas.
- Resize them so the most important information is easiest to see.
A practical layout pattern is:
- top row for large KPI widgets
- middle row for progress or trend widgets
- lower row for lists, alerts, or notes
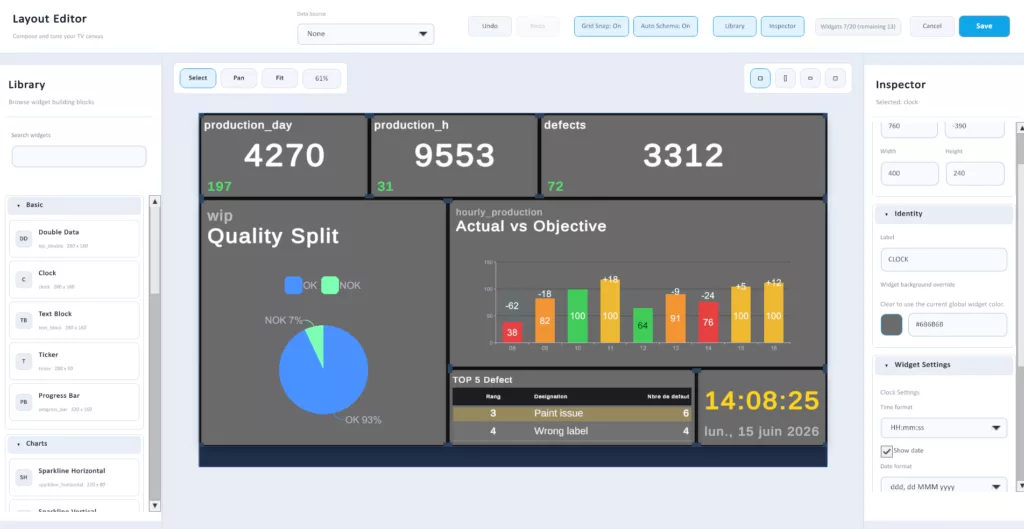
16. Set the Widget Labels Carefully #
Every data-driven widget has a label.
That label is important because Twinnoverse uses it to store and retrieve the runtime value for that widget.
Use labels that are:
- clear
- unique inside the layout
- easy to understand later
Good examples:
SHIFT_OUTPUTSHIFT_TARGETOPEN_ALERTSSUPERVISOR_NOTE
Avoid vague labels such as:
KPI1BOXTEST
17. Save the Layout #
Save the layout after the structure looks correct.
Part 5: Bind the Manual Data Source to the Layout #
18. Assign the Data Source at Layout Level #
- While the layout is open in the layout editor.
- Deselect all widgets so that no individual widget is selected.
- In the layout-level inspector, choose the Manual data source you created earlier.
- Save the layout again.
This step links the layout to the Manual KPI workflow.
Without this step, the layout will not use the manually entered values.

Part 6: Create the Playlist #
19. What a Playlist Is #

A playlist is the normal playback plan for the device.
It controls:
- which layouts the device can play
- the order they play in
- how long each layout stays on screen before the next one appears
If you only have one layout, you still usually place it inside a playlist so the device has a normal playback source.
20. Create the Playlist #
- Open Playlists.
- Create a new playlist.
- Give it a clear name, for example:
Line 1 Manual DashboardWarehouse KPI Rotation
- Add the layout you created.
- Set the layout duration.
- Save the playlist.
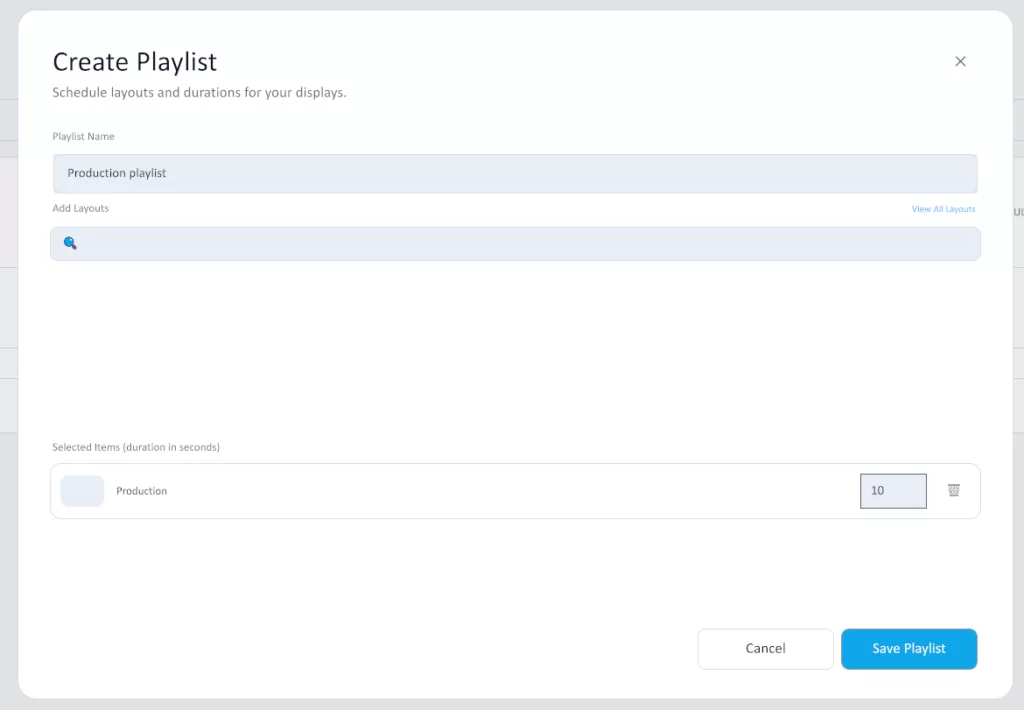
21. Choosing the Layout Duration #
The duration tells the device how long to keep the layout on screen.
If the playlist contains only one layout, the duration is still part of the playlist definition.
Practical guidance:
15 to 30 secondsfor a fast operational dashboard30 to 60 secondsfor a denser screen- longer only if the layout contains a lot of detailed reading
If you later add more layouts to the playlist, the device will rotate through them using those durations.
Part 7: Assign the Playlist to the Device #
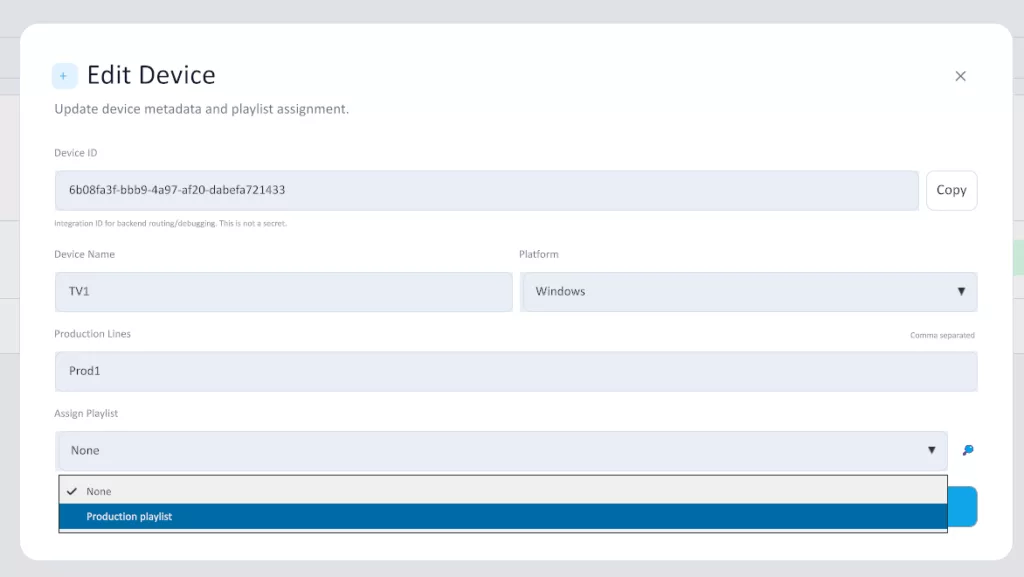
22. Open the Device #
- Open Devices.
- Select the device you claimed earlier.
- Edit the device assignment.
23. Assign the Playlist #
- Select the playlist you created.
- Add a prodline id.
- Save the device.
At this point, the TV now knows which layout or layouts it should use during normal playback.
Part 8: Enter the Manual KPI Values #
24. Open the Manual KPI Area #
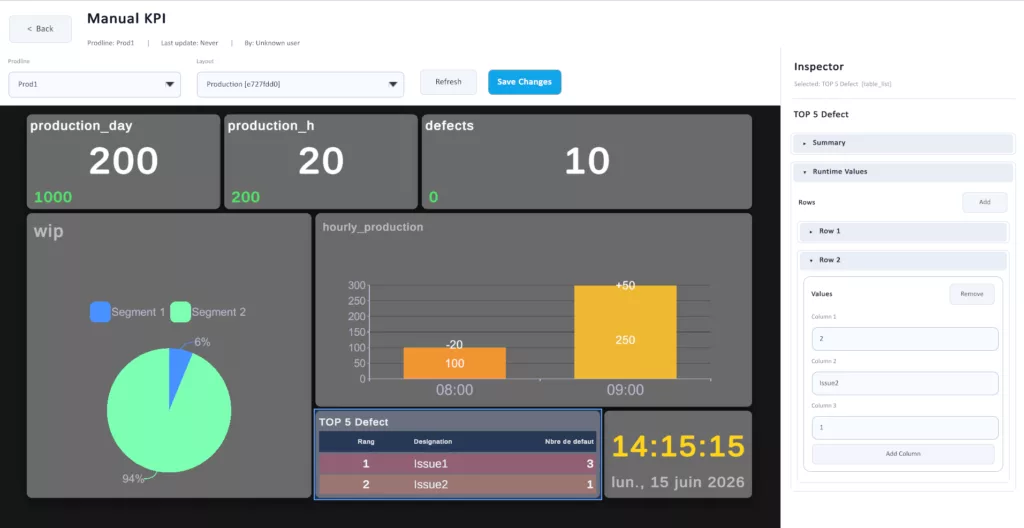
- Open Manual KPI in the admin portal.
25. Select the Production Line #
Choose the production line that this TV belongs to.
This matters because Manual KPI values are stored by:
- layout
- production line
They are not stored per device.
This means:
- two TVs on the same production line can show the same Manual KPI values
- two prodlines on the same TV(you can achieve that by insert prodline separated by “,”) can have each one its own data.
- one TV does not get its own private copy of the Manual KPI data
26. Select the Layout #
Choose the layout that you created earlier.
Twinnoverse loads the layout preview and the editable runtime values for that production line.
27. Edit the Widget Values #
- Click a widget in the preview.
- Use the inspector panel to enter or change the value.
- Repeat for each widget that should show manual data.
Examples:
- KPI: enter one number
- KPI Double: enter two related values
- Progress Bar: enter current and total
- Target Actual: enter target and actual
- Sparkline: enter the series values
- Table List: enter the rows
- Alerts List: enter alert items
- Text Block: enter the note or message
28. Save the Manual Snapshot #
After entering the values, save the Manual KPI snapshot.
This makes those values available to the TV for that layout and production line.
Part 9: Verify the TV #
29. Confirm the Device Setup #
Check all of these in the admin portal:
- the device exists
- the device is claimed
- the correct playlist is assigned
- the playlist contains the correct layout
- the layout uses the Manual data source
30. Confirm the Screen Output #
Look at the TV and confirm:
- the layout appears
- the manually entered values are visible
- the text is readable from the normal viewing distance
- the device remains connected
31. If the TV Shows the Wrong Thing #
Check these common causes:
- the layout was not assigned to the playlist
- the playlist was not assigned to the device
- the layout was not bound to the Manual data source
- the Manual KPI values were not saved
- the wrong production line was selected when entering the data
Part 10: Ongoing Daily Use #
After the first setup, normal daily operation is simple:
- open Manual KPI
- choose the production line
- choose the layout
- update the values
- save
- confirm the TV reflects the changes
This is the normal workflow when the dashboard is operator-driven instead of API-driven.
Quick Summary #
To build a Manual KPI dashboard:
- install the Reader APK on the TV
- claim the device
- create a Manual data source
- create the layout for a 16:9 landscape screen
- add and label the widgets
- bind the Manual data source to the layout
- create a playlist
- assign the playlist to the device
- enter the Manual KPI values
- verify the TV output


