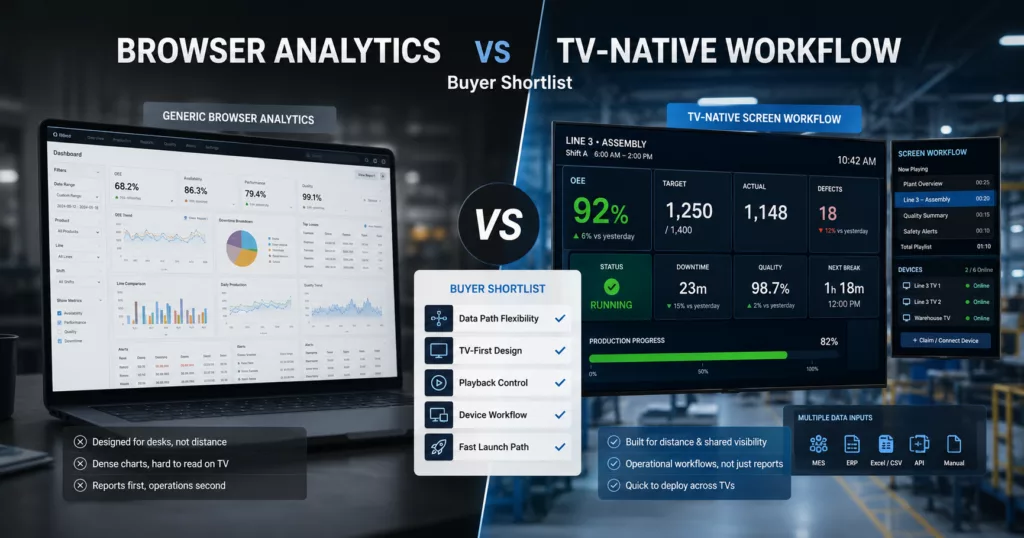
Power BI vs TV dashboard is not mainly a chart comparison. It is a workflow comparison. Power BI is strong when the goal is reporting, analysis, and business visibility. A TV-native operations dashboard is stronger when the screen itself becomes part of day-to-day execution.
That difference matters because many teams assume that if a report can be shown fullscreen on a TV, the rollout problem is solved. Usually it is not. Once the screen is shared on a wall, the team also has to manage readability, playback, device assignment, and what happens when the data or screen setup changes after launch.
Where Power BI fits well
Power BI is usually the better fit when the main job is:
- browser or desktop KPI reporting
- drill-down analysis by supervisors, analysts, or leadership
- centralized reporting across many business functions
- exploration of trends, breakdowns, and ad hoc questions
If your operational need ends at analytics, Power BI can be the right answer.
Where TV dashboard software fits better
TV dashboard software becomes the better fit when the screen itself has to be operationally dependable. That usually means:
- people need to read the screen from a distance in seconds
- the TV is shared across shifts, lines, or teams
- more than one layout or message needs controlled playback
- the team needs to claim, assign, preview, and recover physical screens
- the rollout may start with Manual data, REST API, WebSocket, or Ingest
At that point, the comparison shifts from BI software versus BI software to reporting software versus TV operations software.
The workflow gap buyers often miss
The most common mistake in this comparison is assuming browser fullscreen equals a complete TV workflow.
In practice, fullscreen output is not the same as:
- playlist-based playback
- device lifecycle management
- TV-first layout hierarchy
- mixed rollout paths across different plants or lines
That is why some teams feel good after the demo but struggle after the first real deployment.
A side-by-side comparison
Book a TV Dashboard
If you are deciding between Power BI and a TV-native operations dashboard, the fastest way to narrow the choice is to review your actual screen workflow. A fit review helps clarify whether the requirement is mainly reporting, TV operations, or a mix of both.
How to choose the right path
Use Power BI first when your main goal is analysis. Use TV dashboard software first when the screen must stay readable, assigned, and trustworthy on the wall.
Ask these questions before deciding:
- Is this screen for exploration or for immediate shared visibility?
- Does the rollout need device claiming, preview, and playback planning?
- How clean is the current data environment at the first site?
- Will the team manage one screen or a growing screen fleet?
If the screen is operationally important, start by mapping the TV workflow first. That usually makes the answer clear.
Is Power BI good for operations dashboards?
Yes, especially for reporting and analysis. The gap appears when the requirement expands into shared TV playback, device control, and rollout workflow.
Can Power BI run on a wall-mounted TV?
Yes. The question is whether that setup is enough for your day-to-day screen workflow once you need management of devices, playback, and rollout changes.
What is a TV-native operations dashboard?
It is dashboard software built around physical screens, including layouts, playback, device assignment, preview, and flexible data paths.
When should a team choose TV dashboard software instead of Power BI?
Choose TV dashboard software when the screen itself is part of operations, not just a passive place to display a report.
Next Step
If you want to test the TV-dashboard path before committing to a larger rollout, start with a simple wall-screen setup and validate the workflow in a real operating environment.